The NPS survey is easy to launch and easy to misunderstand. Starting with a precise NPS score definition, this guide explains what Net Promoter Score actually says, what it leaves out, and how marketers and managers can use it without turning a signal into a verdict.
Patrick Diogenia | Adapted from a conceptual working paper | July 2026
Almost every modern transaction now ends with a small administrative afterlife. The package arrives, the technician leaves, the call disconnects and, sometimes before the customer knows whether anything worked, an email asks how likely they are to recommend the experience to a friend or colleague.
Most friends are not waiting breathlessly for our cable-provider recommendations. Organizations ask anyway because the answer can be converted into Net Promoter Score, or NPS: a number that travels easily from a customer’s phone to a manager’s dashboard and, from there, into presentations, performance reviews, investor materials and compensation plans.
The popularity of the metric creates an odd problem. People encounter an NPS survey everywhere, yet many marketers and managers remain unclear about the definition of NPS score, the net promoter score calculation, what the NPS question actually asks, whether a net promoter score survey needs additional questions, or whether employee NPS measures engagement. The formula is simple. The managerial meaning is not.
My working paper, The Diffusion of a Contested Metric: Net Promoter Score as a Managerial Innovation, examines why NPS became organizational common sense despite sustained criticism of its validity, scoring logic and incentive effects. This guide turns that analysis into practical advice: how to calculate NPS correctly, how to design an NPS survey without exhausting respondents, how to interpret eNPS, how to choose NPS tools, and how to prevent a clean number from replacing the experience it was meant to describe.
NPS Score Definition: What Does Net Promoter Score Mean?
NPS stands for Net Promoter Score. The clearest NPS score definition is a single-item customer-experience index calculated from answers to a 0–10 recommendation question. Respondents who choose 9 or 10 are classified as Promoters, those who choose 7 or 8 as Passives, and those who choose 0 through 6 as Detractors. The percentage of Detractors is subtracted from the percentage of Promoters, producing an NPS score between −100 and +100.
That definition is intentionally narrow. NPS summarizes stated willingness to recommend among the people who answered a particular survey. It is not a percentage, even though percentages are used in the NPS calculation. It also does not directly establish satisfaction, loyalty, retention, actual referrals, service quality or growth. Those may be related to recommendation intention, but they remain different outcomes and should be measured rather than assumed.
The Net Promoter Score is also distinct from the broader Net Promoter System. The score is the numerical result. The system is the management approach built around collecting feedback, following up with respondents, identifying causes and changing operations. An organization can calculate an NPS score correctly while running the surrounding system poorly—which is one reason the rest of this guide focuses as much on sampling, timing and incentives as on arithmetic.
What question does NPS actually ask?
The canonical net promoter score question is: “How likely are you to recommend us to a friend or colleague?” Respondents answer on a scale from 0, usually labeled “not at all likely,” to 10, usually labeled “extremely likely.” Bain’s Net Promoter System materials use this wording as the basis of the score.1
Organizations often substitute the name of a company, brand, product, service or episode: “How likely are you to recommend Acme Bank?” or “Based on your recent support experience, how likely are you to recommend Acme?” That adaptation is practical, but it changes the object being evaluated. A relationship NPS question asks about the brand or organization as a whole; a transactional NPS question asks after a particular interaction. One should not be quietly substituted for the other and then plotted as though the series were continuous.
The wording also matters because NPS does not ask, “Were you satisfied?” It does not ask whether the problem was solved, whether the customer will renew, whether the customer has recommended the company, or whether the service produced a technically sound outcome. It asks for a prediction about hypothetical advocacy. In many consumer settings that prediction may be meaningful. In others—medical care, utilities, government services, a payroll platform chosen by one’s employer—the idea of recommending the provider can be awkward or only loosely connected to the user’s actual choice.
Timing compounds the problem. If a survey arrives immediately after an auto repair, legal consultation, medical appointment or lawn treatment, the respondent may be able to judge courtesy and communication but not the eventual outcome. July 2026 Forrester research adds a second warning: post-journey surveys can omit customers who never completed the journey and can be sent before customers know whether their goal was achieved.2 A precisely worded question cannot rescue a badly chosen moment or a sample that excludes the people who struggled most.
How is Net Promoter Score calculated?
The standard NPS score calculation divides valid responses into three groups:
- Promoters: respondents who select 9 or 10.
- Passives: respondents who select 7 or 8.
- Detractors: respondents who select 0 through 6.
The NPS calculation uses the formula NPS = percentage of Promoters − percentage of Detractors. The result ranges from −100, when every respondent is a Detractor, to +100, when every respondent is a Promoter. It is conventionally reported as a whole number, not as a percentage. A score of 35 should therefore be written NPS +35, not “35% NPS.”
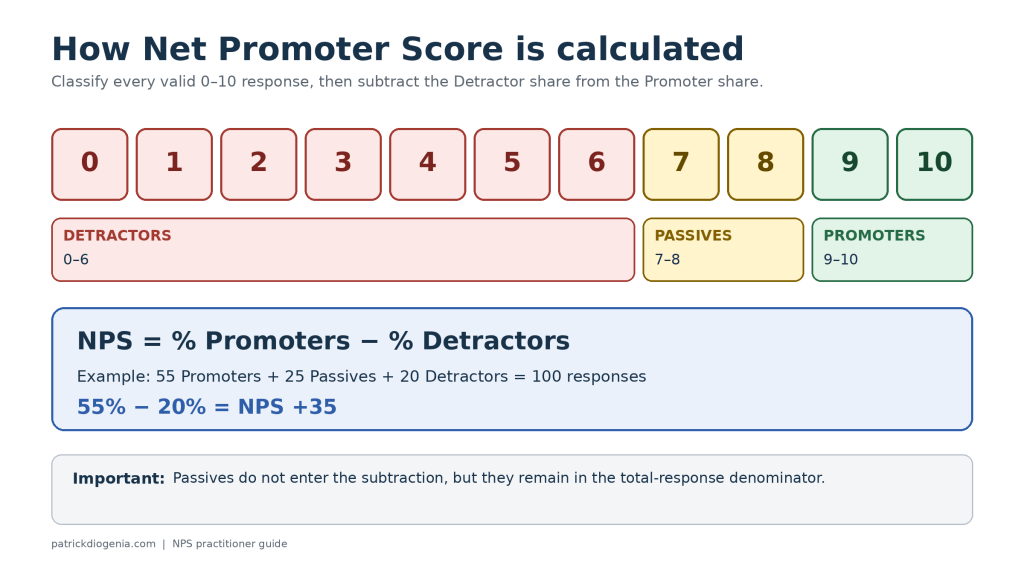
In the example above, 55 of 100 respondents are Promoters, 25 are Passives and 20 are Detractors. The net promoter score calculation is 55% − 20% = +35. Passives are sometimes said to be “ignored,” but that shorthand causes confusion. They are not added or subtracted; they still count among the 100 responses used to calculate each percentage.
This compression is part of both NPS’s appeal and its weakness. Consider two surveys. Survey A contains 60% Promoters, 10% Passives and 30% Detractors. Survey B contains 30% Promoters, 70% Passives and no Detractors. Both produce NPS +30. The first describes a polarized customer base; the second describes a largely unenthusiastic one. A dashboard that shows only the score makes those organizations look identical.
Academic critiques focus on precisely this loss of information: the 0–10 distribution is collapsed into three groups, an 8 and a 9 are placed on opposite sides of an important boundary, and the cutoffs are often carried across countries and sectors without fresh validation. Studies and reviews have questioned NPS precision, predictive superiority and the assumption that stated likelihood to recommend maps neatly onto growth or actual word of mouth.3 The practical response is not to perform the arithmetic differently. It is to retain the underlying distribution and interpret the result with proportion.
What does an NPS score measure—and what does it leave out?
At its most defensible, NPS is a compact attitudinal indicator: among respondents reached by a particular survey, it summarizes stated willingness to recommend at a particular time. This is the most useful working definition of an NPS score because it identifies both the signal and its boundaries. If the sampling, channel, wording and timing remain reasonably stable, the score can provide a useful directional trend. It can draw executive attention to customers, identify groups for follow-up and create a common language across functions.
Problems begin when the label expands faster than the evidence. NPS is often spoken of as though it directly measures loyalty, advocacy, satisfaction, service quality, retention and growth at once. Those constructs overlap, but they are not interchangeable. A customer may recommend a brand yet leave because of price. Another may remain because switching is difficult while warning friends to stay away. A patient may praise a clinician’s manner before learning whether a treatment worked. The response is real; the interpretation can still be too ambitious.
Response bias is another boundary. NPS describes respondents, not automatically the full customer population. People with unusually positive or negative experiences may be more motivated to answer, while customers who abandon a journey may never enter the survey frame. A rising score can reflect a better experience, a different mix of respondents, a change in channel, altered timing, more aggressive reminders or selective survey distribution. Without invitation counts, completion rates and sampling rules, the score arrives with too little biography.
For marketers, this means joining NPS to customer behavior: retention, repeat purchase, product use, referrals, complaint resolution and lifetime value where appropriate. For operations leaders, it means pairing the score with waiting time, first-contact resolution, defect rates, missed appointments and outcome measures. For researchers, it means reporting sample size and uncertainty instead of treating a two-point movement as a weather event that everyone can see.
Which NPS survey questions are required?
Only one question is required. The 0–10 recommendation item supplies everything needed to calculate NPS. NPS survey tools may invite you to build a longer questionnaire, but the additional items are not part of the NPS calculation. They are there to explain, segment or act on the answer.
A lean net promoter score survey usually benefits from one open-ended follow-up: “What is the main reason for your score?” If the organization genuinely plans to contact customers, it can also ask permission to follow up. A small number of targeted driver questions may be useful when the answers correspond to decisions someone is prepared to make. If the CRM already knows the customer’s product, channel, tenure and transaction, asking the customer to type them again is not research. It is clerical work reassigned to the respondent.
Traditional CSAT and customer-effort questions can be added, but they answer different questions. CSAT typically asks how satisfied someone was with a product or interaction. Customer Effort Score asks how easy or difficult it was to accomplish a goal. NPS asks about recommendation intention. Keeping the measures distinct is more informative than blending them into an all-purpose index with an impressive decimal point.
There is a trade-off. Every added question increases burden, and longer questionnaires can reduce participation, completion or response quality, although the size of the effect depends on mode, audience and design.4 Use branching logic, avoid asking for known data, test the survey on a phone and remove any question that lacks a named decision owner. The objective is not the shortest survey imaginable. It is the shortest survey that supports a real action.
What is eNPS, and is employee NPS effective?
eNPS, or Employee Net Promoter Score, adapts the customer measure to employment. A typical eNPS survey asks: “On a scale from 0 to 10, how likely are you to recommend this organization as a great place to work?” The eNPS score uses the same categories and subtraction as customer NPS: 9–10 are Promoters, 7–8 are Passives and 0–6 are Detractors.
As a pulse, employee NPS has attractions. It is inexpensive, familiar and easy to trend. A sudden change can signal that something deserves investigation. Yet the evidence base is thinner than the confidence with which eNPS often appears on people dashboards. Available studies suggest substantial overlap with job satisfaction, affective commitment, person–organization fit and intention to leave, while also warning that the asymmetric scoring can produce misleading values.5 Even a major employee-survey platform cautions that eNPS is not sufficient as a standalone measure of engagement.6
The employment context also changes the meaning of the response. Customers can often ignore a survey with few consequences. Employees may reasonably wonder whether their criticism is anonymous, whether a manager will identify a small team, or whether low scores will trigger pressure rather than reform. “Would you recommend this as a place to work?” can also reflect pay, labor-market conditions, organizational prestige, remote-work policy or the experience of one supervisor. Calling the result engagement does not make those distinctions disappear.
How should you evaluate NPS survey tools?
Search results for NPS survey tools tend to emphasize templates, dashboards and automatic NPS calculation. Those are useful conveniences. They are also the easy part. Medallia NPS capabilities, for example, include NPS question types, reporting and closed-loop workflows; Qualtrics offers built-in NPS questions, logic, dashboards and workflow tools; SurveyMonkey provides lighter-weight survey creation and calculation guidance.7 None of those features, by itself, determines whether the sample is representative or the question is timely.
When comparing NPS tools, evaluate the operating system around the score:
- Sampling control: Can you document who was eligible, who was invited, who was excluded and who responded?
- Frequency rules: Can you prevent the same customer or employee from being surveyed repeatedly?
- Journey timing: Can invitations be triggered after the outcome is knowable, not merely after the organization’s last recorded event?
- Integration: Can responses be joined safely to CRM, CDP, transaction, service and outcome data without asking respondents to repeat known facts?
- Distribution visibility: Does the dashboard retain the 0–10 responses, category shares, sample size and response rate instead of showing only NPS?
- Text and case management: Can comments be coded, routed and closed without turning follow-up into a campaign for higher scores?
- Governance and privacy: Are role-based access, audit logs, consent, retention rules and eNPS anonymity thresholds available?
- Method-consistent benchmarks: Can the provider explain whether external scores use comparable wording, timing, channel, population and weighting?
- Exportability: Can analysts retrieve response-level data and invitation metadata for independent checks?
The best NPS survey tool is therefore not necessarily the one with the most animated gauge. It is the one that makes sound sampling, transparent analysis and responsible follow-up easier—and makes selective distribution or quiet method changes harder.
Why did NPS spread so widely despite the criticism?
The persistence of NPS is often framed as a contest between believers and critics. That misses the more interesting organizational question. Management practices do not spread only because they outperform alternatives in controlled comparisons. They spread because they fit how organizations communicate, compare, purchase technology and assign responsibility.
Diffusion theory helps explain the attraction. NPS appeared advantageous relative to long satisfaction studies; it was compatible with dashboard-driven management; it reduced perceived complexity; it was easy to pilot; and its results were highly visible. The score also arrived as part of a reinforcing cluster: a memorable article, Bain’s consulting network, books, certification, software, benchmarks, professional communities, dashboards and incentive systems. Later adopters did not encounter one survey question. They encountered a nearly complete managerial package.
Visibility created institutional pressure. Once competitors reported NPS and vendors built it into their platforms, declining to use it could look less like methodological caution and more like managerial backwardness. NPS became a ceremonial marker of customer-centric, data-driven management: a complex reality translated into a number that could survive a meeting.
That history does not prove NPS useless. It explains why adoption is not evidence of validation. The metric may be organizationally successful because it is portable and consequential even where its technical claims remain contested. My working paper develops this argument through diffusion, institutional and management-fashion scholarship.8
Ten lessons for marketers and managers
The sensible response is neither to worship NPS nor to stage a ceremonial execution of the dashboard. Use the signal, but govern the system around it.
- Begin with the decision. Define what the organization will do differently if the result rises, falls or reveals a recurring theme. A survey without a decision path produces feedback inventory, not insight.
- Choose relationship or transactional NPS deliberately. Relationship NPS tracks the broader brand relationship; transactional NPS follows a particular episode. Label them clearly and do not merge them into one trend line.
- Survey when the customer can know the answer. Match timing to the journey and the service. Include failed and abandoned journeys where feasible; otherwise the sampling frame may edit out the experience most in need of attention.
- Keep the method stable. Record wording, scale labels, channel, trigger, reminder cadence, eligibility, exclusions and weighting. When any of these change, mark the break rather than celebrating an unexplained improvement.
- Protect the sample. Use documented rules and frequency caps. Audit invitation logs for selective suppression. Report response and completion rates, not only the number of completed surveys.
- Show the score's ingredients. Put Promoter, Passive and Detractor shares, the 0–10 distribution and sample size beside the NPS calculation. Add uncertainty when comparing small groups or short periods.
- Pair attitudes with evidence. Join NPS to comments, complaints, repeat behavior, retention, operational measures and outcomes. The combination can explain why a score moved and whether the underlying experience changed.
- Close the loop without coaching the score. Contact customers to solve problems and learn. Do not ask staff to plead for 9s and 10s, withhold surveys from difficult cases or treat a follow-up call as successful because the customer revises the rating.
- Separate employee control from system control. Frontline staff influence experience but rarely control pricing, staffing, policies, product defects or technology. Avoid tying individual pay or continued employment to noisy NPS results, especially on small samples.
- Treat movement as a hypothesis. A rising score is a reason to investigate what changed, not proof that the latest campaign caused the change. Use experiments, holdouts, cohort analysis or operational comparisons when the causal question matters.
NPS questions managers ask most often
What does NPS stand for?
NPS stands for Net Promoter Score. It is calculated by subtracting the percentage of Detractors, who answer 0–6, from the percentage of Promoters, who answer 9–10. Passives, who answer 7–8, remain in the total-response denominator but do not enter the subtraction directly.
What is a good NPS score?
There is no universal good score. Industry, country, brand set, survey timing, relationship type and sample design all matter. Compare like with like, prioritize a stable internal trend, and demand methodological detail before treating an external benchmark as a target. A score can be above an industry average while the experience is deteriorating for a valuable segment.
Can NPS be negative?
Yes. NPS is negative whenever the share of Detractors exceeds the share of Promoters. Negative does not mean that every customer is unhappy; it describes the balance of the two categorized groups among respondents.
Is NPS a percentage?
No. Percentages are used in the formula, but the final result is an index from −100 to +100 and is normally reported without a percent sign.
How large should an NPS sample be?
There is no single minimum. The required sample depends on the population, desired precision, sampling design and the comparisons you intend to make. Report the number of responses and uncertainty; avoid ranking stores, managers or small employee teams on unstable differences.
How often should an NPS survey be sent?
Often enough to support a decision, not after every detectable movement. Transactional programs should use frequency caps; relationship programs may run periodically. Coordinate invitations across departments so that one customer does not receive separate evidence of every internal reporting line.
Is NPS better than CSAT?
They answer different questions. NPS concerns recommendation intention; CSAT concerns satisfaction, usually with an interaction or offering. Select the measure that matches the decision and use both only when the additional burden earns additional insight.
Does eNPS measure employee engagement?
Not by itself. An eNPS survey can provide a compact advocacy signal, but employee engagement is broader and is usually measured more reliably with multiple items covering energy, commitment, enablement and related conditions.
Do NPS tools calculate the score automatically?
Most do. Automation prevents arithmetic errors; it does not resolve question fit, sampling bias, timing, interpretation or incentives. The calculation is the least difficult part of an NPS program.
A useful signal requires managerial restraint
NPS became durable because it solved a managerial communication problem. It made a diffuse concept visible, portable and comparable. That achievement deserves to be understood even by those who remain skeptical of the metric’s larger claims.
For marketers, the lesson is to preserve the customer’s context around the score. For managers, it is to distinguish measurement from control: a frontline employee may influence an experience without controlling the system that produced it. For both, the standard should be modest but demanding. Ask a clear question, sample honestly, retain the underlying data, join attitudes to outcomes and act on what the evidence can support.
A metric should help an organization notice reality. Once the organization begins reorganizing reality to protect the metric, the dashboard has ceased to be an instrument and become an audience.
Read the working paper and download the fact sheet
Notes and sources
- Bain & Company, “Measuring Your Net Promoter Score,” and Frederick F. Reichheld, “The One Number You Need to Grow,” Harvard Business Review 81(12), 2003. The Bain page states the canonical question and calculation. Bain NPS calculation | Reichheld article
- Maxie Schmidt and Hannah Jachim, “Your Journey Surveys Overestimate NPS,” Forrester, July 10, 2026. The practitioner analysis reports that post-journey surveys may exclude non-completers and arrive before customers know whether their goal was achieved. Forrester analysis
- See John G. Dawes, “The Net Promoter Score: What Should Managers Know?” International Journal of Market Research 66(2–3), 2024; Kai Kristensen and Jacob K. Eskildsen, “Is the NPS a Trustworthy Performance Measure?” The TQM Journal 26(2), 2014; and Nicholas I. Fisher and Raymond E. Kordupleski, “Good and Bad Market Research,” Applied Stochastic Models in Business and Industry 35(1), 2019. Dawes DOI | Kristensen and Eskildsen DOI | Fisher and Kordupleski DOI
- Questionnaire length is not the only determinant of response, and effects vary by setting. A 2022 randomized mixed-mode experiment by Frida Sandelin found that the longer questionnaire reduced response by 2.7 percentage points overall; the detected effect was confined to paper respondents, and the study found no measurable decline in data quality. The broader design principle is to minimize unnecessary burden rather than assume an invariant penalty per item. Methodology note
- Tessa Legerstee, Asking Employees “The Ultimate Question”: Developing the Employee Promoter Score, Erasmus University Rotterdam, 2013; Piotr Sedlak, “Employee Net Promoter Score (eNPS) as a Single-item Measure of Employee Work Satisfaction,” 2020. Legerstee thesis | Sedlak DOI
- Culture Amp describes eNPS as useful input but says the item is not sufficient to understand engagement and is not robust enough as a standalone measure. Culture Amp eNPS guidance
- The examples describe current product documentation, not vendor endorsements. Medallia NPS documentation | Qualtrics NPS question | SurveyMonkey NPS guide
- Patrick T. Diogenia, The Diffusion of a Contested Metric: Net Promoter Score as a Managerial Innovation, Working Paper Version 1.0, July 2026. Project page